Harnham put out a survey of UK data and analytics jobs annually which seemed more than worthy of a closer look. Below are what I have gleaned from the data in the report.1
Data
These data cover London-based and outside-of-London based jobs, and so one obvious question is how salaries would reflect the location difference. It turns out the pay premium for London-based roles is c. 20%, although this varies by job role grouping.2
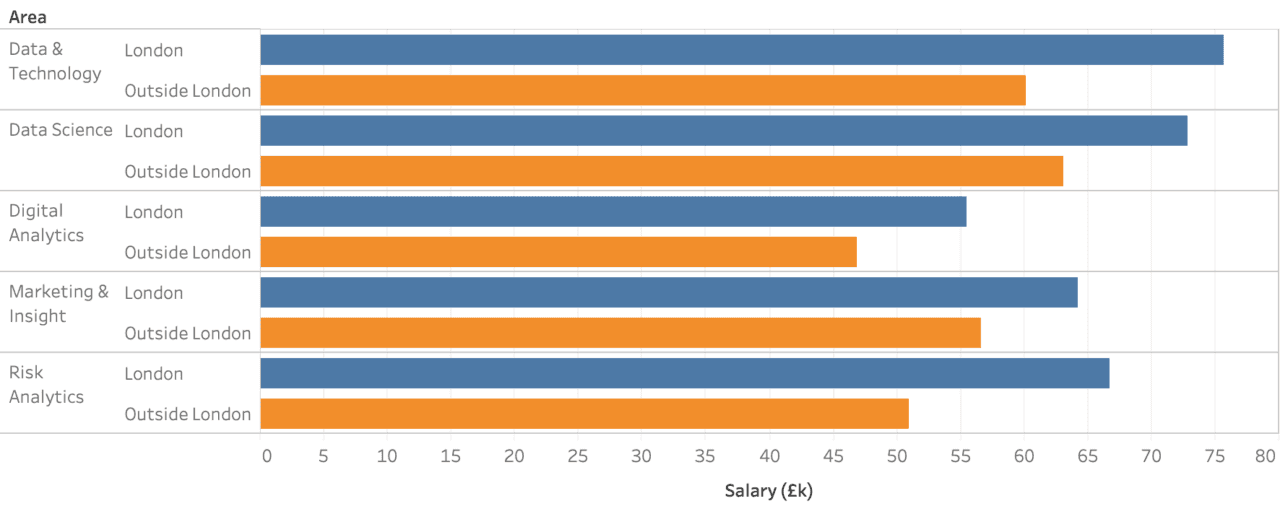
The job roles in each grouping are as follows:
| Grouping | Role |
|---|---|
| Data & Technology | Business Intelligence, Data Architecture, Data Eng & Big Data, Data Governance, DevOps, Software Engineering |
| Data Science | Computer Vision, Data Scientist, Deep Learning, Machine Learning Eng., Natural Language Proc. |
| Digital Analytics | AdTech, Conversion Rate Opt., Implementation, Paid Media, Product Management, Programmatic, UX / UI, Web Analytics |
| Marketing & Insight | Campaign & CRM, Econometrician, Insight Analyst, Market Research, Pricing Analyst |
| Risk Analytics | Decision Systems, Fraud Analyst, Modelling (Dec. Sci.), Portfolio Management |
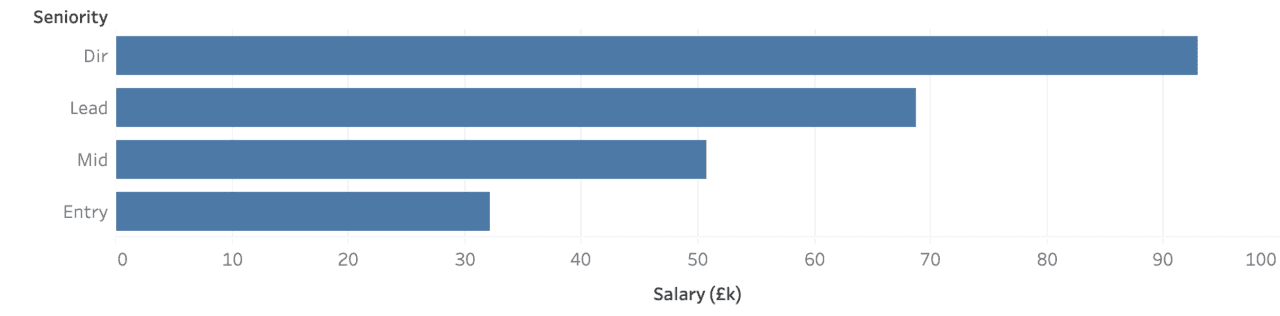
On average there is a c. £20k change associated with a change in the level of seniority, entry- to mid-level, mid-level to xyz-lead, etc.3
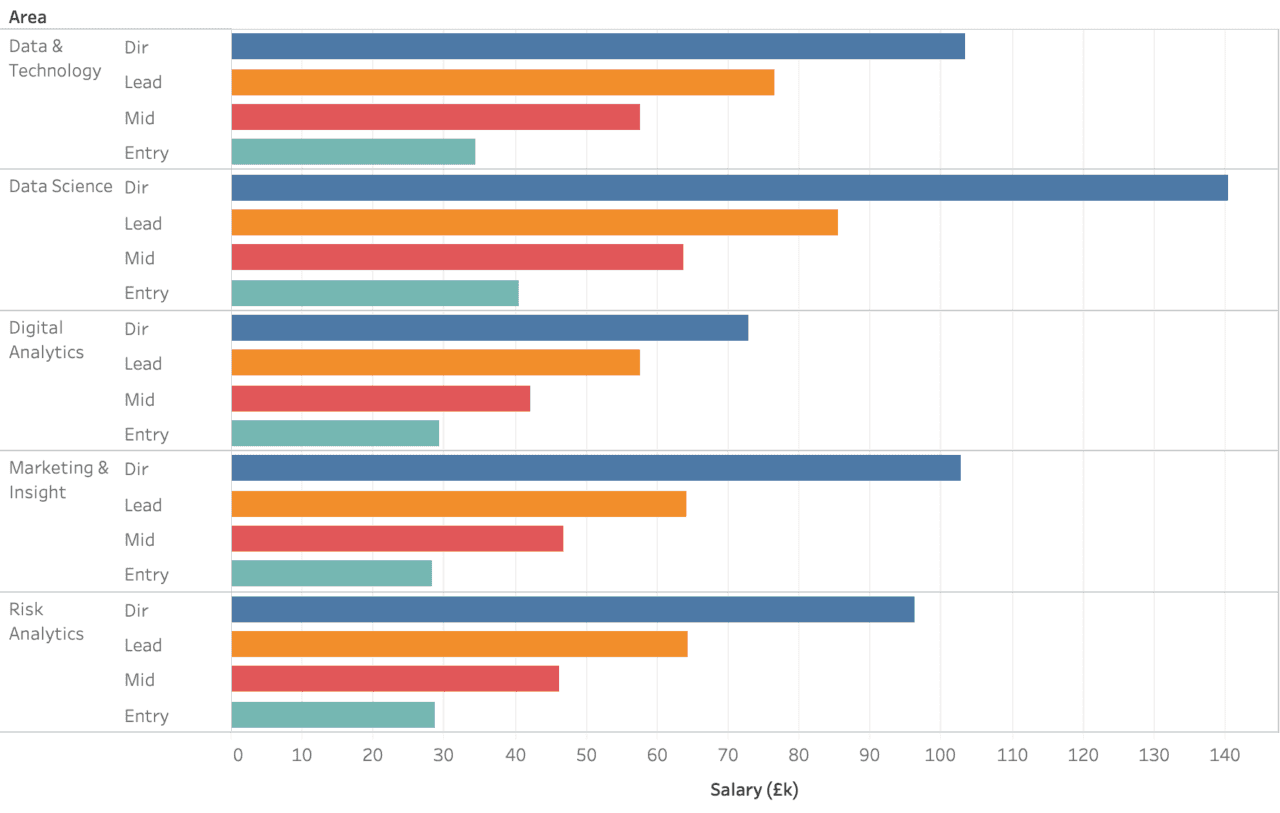
Looking at progression and also taking into account job areas, we can see that in some areas the progressions are more marked: the chief data scientist enjoys a bigger premium over their juniors than a director of digital analytics, for instance.
And finally we can see that the higher the salary associated with the job role, the greater the variance in those salaries.
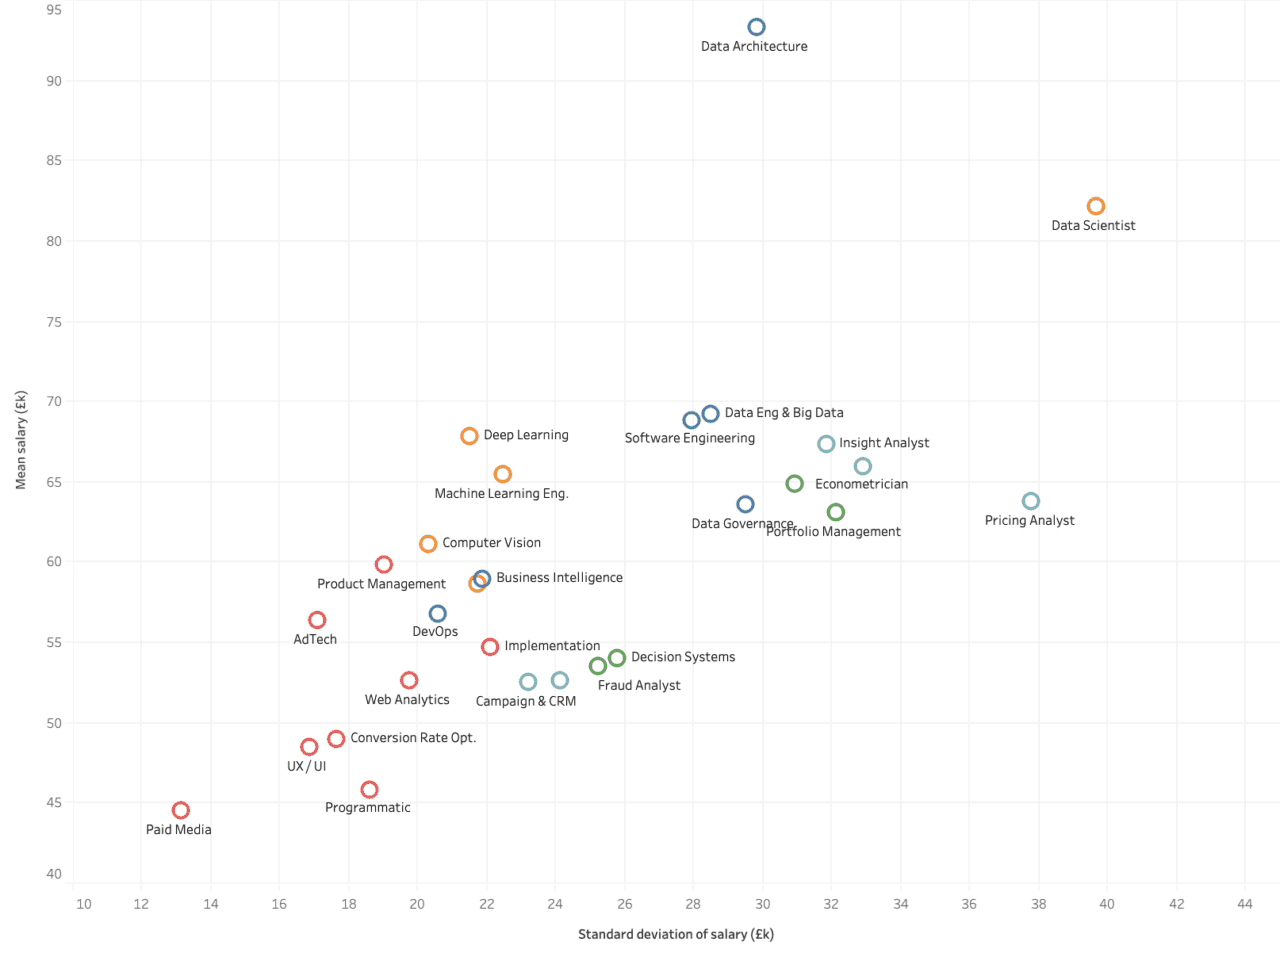
The correlation between mean and standard deviation of salary for a given job role is quite marked, with the mean salary approximately half determining the standard deviation or vice versa (i.e. ). Only Data Architecture is an obvious outlier (excluding this, ). My guess would be that large financial institutions are responsible for Data Architecture doing so well in these data, particularly considering the premium for cloud know-how.4
Inference
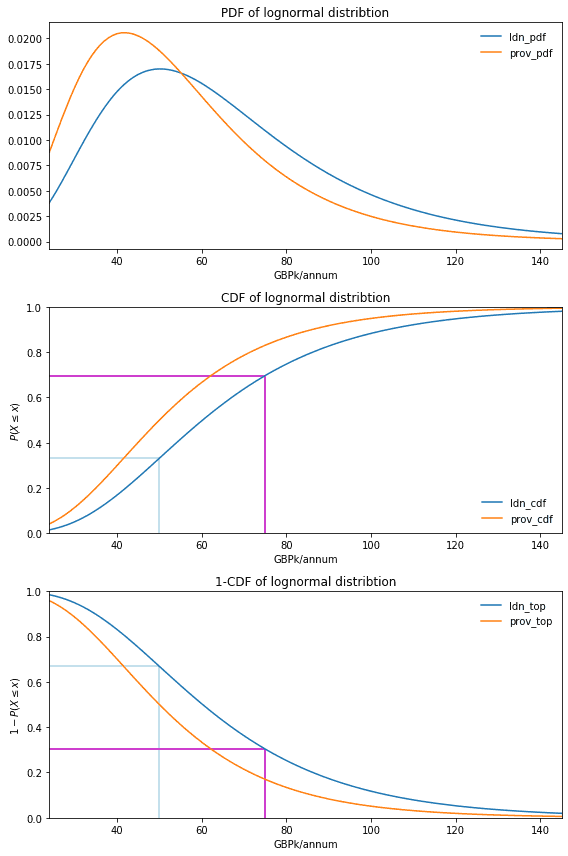
Given a sample mean and a sample standard deviation for both London-based and outside-London-based data and analytics roles, it would seem like something of a waste not to come up with some sort of model. Salaries roughly follow a log-normal distribution, so we can take advantage of that to do some inference.5
Given the CDF of this distribution, we can then read off from the second chart what proportion is below that value according to the distribution. By way of example, a value of 50 on the x-axis corresponds to c. 0.33 on the y-axis so we can deduce that a London-based data and analytics worker is in the bottom c. 33% by salary. This is shown by the light blue lines in the second chart.
As it is more natural to read off ‘top y%’ than ‘bottom y%’, we can similarly read off from the third chart 1-CDF and use that to read off what ‘top y%’ is associated with a given salary on the x-axis. By way of example, a value of 75 on the x-axis corresponds to c. 0.30 on the y-axis so we can deduce that a London-based data and analytics worker is in the top c. 30% by salary. This is shown by the magenta lines in the third chart.
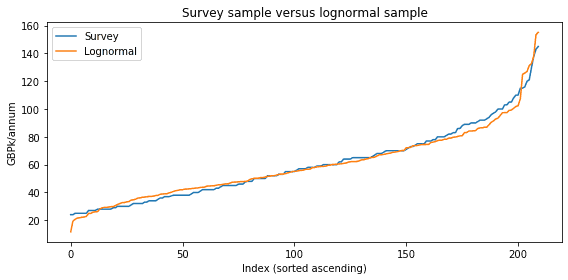
To check how good an approximation of survey data the log-normal distribution is, we can plot samples from the distribution against the survey data.6
- The report itself can be found here: Harnham Data & Analytics UK Salary Survey 2020. There are some 210 salaries included within the report and these are split by role, seniority, and whether based in London or elsewhere in the UK.↩
- A caveat: the mean values here are calculated with equal weightings for entry-level, mid-level, lead, and director-level jobs. As there are more junior than senior jobs within a given organisation or team as a rule, these means will therefore not represent a typical team. Instead, a good way to think of the mean here is that you are sat down for a hypothetical lunch with four team members, one at each of these aforementioned levels, who each provide you with their salary, and you take the mean of those.↩
- London-based and outside-London-based are averaged here, with equal weight. Another analogue: you are sat down for a hypothetical lunch with two team members who are the same level of seniority as you, one who is London-based, one who is not-London-based, who each provide you with their salary, and you take the mean of those.↩
- The standard deviation here captures differences from both the seniority and whether the role is in London or not.↩
- Parameters: London: ; outside London: ; combined: . These sample statistics are after the (natural) log transformation. Note that if is any of these sample statistics, is not the sample statistic for the sample before the transformation.↩
- Mean absolute error: 2.62 (GBPk/annum); mean absolute error / survey mean: 0.04↩