It’s been a strange year in the markets and as the year comes to a close, and the UK formally leaves the EU — which I won’t offer a comment on — UK markets are probably worth another look.
Schumpeter wrote of the occasional “gale of creative destruction” in market-based economies and that seems like an apt description of 2020.1 Where things are bombed-out or there is uncertainty is probably the time to make bets, given that in ‘normal’ times markets seem to be reasonably if not completely efficient.
I will consider reasonably high-level stuff here like sectors, earnings growth, P/E and dividend yield. As a proxy for the UK market, I will consider the FTSE All-Share ex-Investment Companies index (‘FTAX’) which comprises some 422 companies.2
What’s in the index?
Firstly, let’s take a look at the economic sector breakdown:
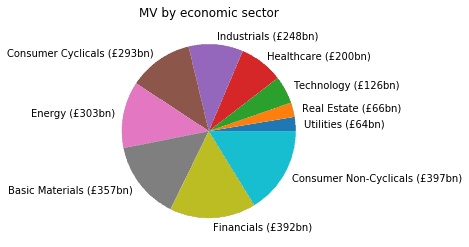
Consumer Cyclicals and Financials are the biggest at around 16% of the total market capitalisation. Unlike the US market, healthcare and technology are small at 8% and 5% respectively. The UK, like Europe in general, is more cyclically exposed than the US. Again, in contrast to the US, the relatively small proportion of technology here is why the PM has been doing the rounds of London-based unicorns in a bid to get them to list here.
At the start of the year it looked like this:
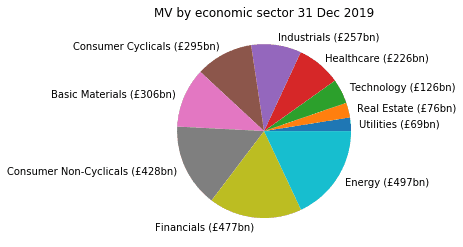
Energy constituted 18% of the index — as we will see later, energy companies have had a shocker this year.
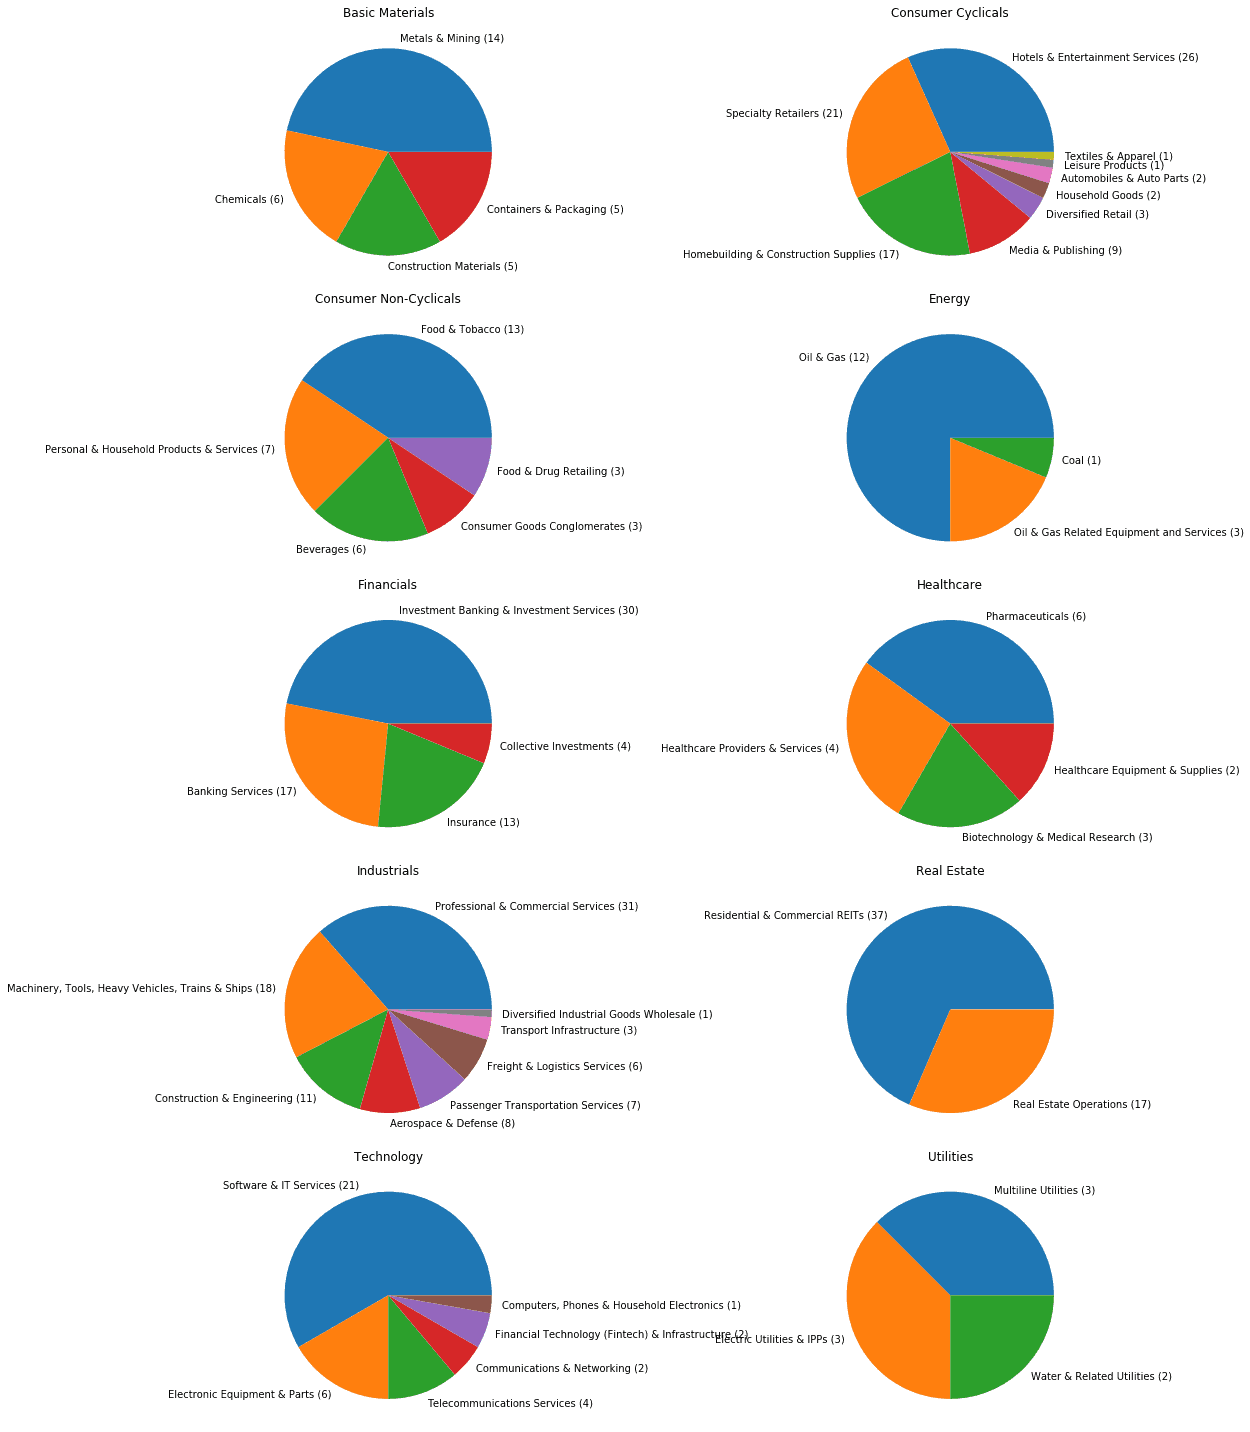
It might be nice to see what sits in each of these economic sectors so here are the breakdowns by number of companies, grouped by industry group.
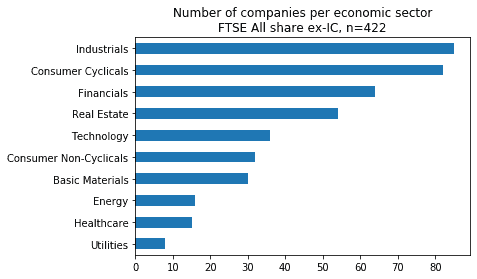
For comparison, here are the numbers of companies in total by economic sector:
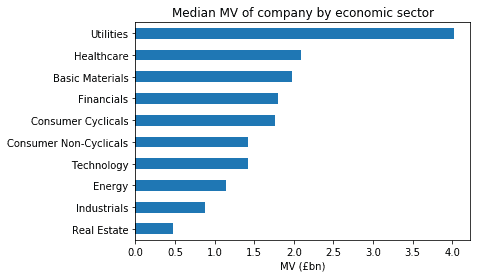
And the median market value of a company within each of these economic sectors:
Which economic sectors have done well and badly this year?
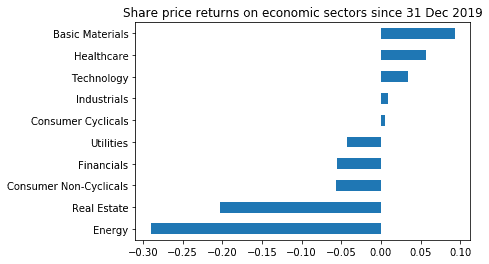
Over the year the big losers have been Energy and Real Estate:
The energy outlook is dominated by factors such as: general economic activity and secular efficiency gains in production from industrial inputs (demand); the move to de-carbonisation in developed and middle-income economies (demand); improvements in extractive technology (supply); and pressure from increasingly ESG-focussed investors (supply).
Fossil fuels are arguably becoming less important — c. 50% of UK electricity was generated from renewable and nuclear sources this year for instance. Coupled to that, investors are increasingly factoring in ESG into their asset allocation decisions and the risk of ‘stranded assets’ is arguably on the increase and no longer a purely theoretical risk. And while hydrocarbons are still very important in modern economies, to create plastics and for heating for instance, the Saudis have the joy of c. $15/barrel oil and so they are likely to outlast the oil majors in a demand draught.
2020 was remarkable in the oil markets as reduced economic activity due to lockdowns and therefore reduced demand for oil coincided with a ramp up in supply. This came about because of a geopolitical game of chicken between Saudi Arabia and Russia and a (mis)calculation by the Saudis that by driving down the price of oil they could deal a fatal blow to the highly-leveraged US shale industry: in early March Saudi Arabia responded to Russia’s refusal to limit output by increasing its output to reduce the price, which meant that by mid-March oil prices were the lowest they had been in 17 years. In mid-April Opec then decided to curtail output, which ended the price war and stabilised prices.
Commercial real estate contracts in the UK tend to be very long term contracts with automatic escalators; as such they have traditionally not been that flexible. This combined with the structural shift in consumer habits away from bricks and mortar retailers being rapidly accelerated by lockdowns has meant a large swathe of defaults and restructurings, with the latter gathering pace even before the pandemic (e.g. Mothercare, Carpetright CVAs in 2018).
For the large commercial landlords things are worst for those with retail/leisure exposure, and somewhat better for those exposed to the best grade of office space, like in the City of London or central Edinburgh — the English are famously a nation of shopkeepers and it has been non-stop carnage for the retail and leisure sectors.3 Intu (shopping centres) went bust in March when it failed to raise equity, and the largest listed real estate investor in the UK, Landsec, reported an 8% decline in portfolio valuation in November. Further, real estate is traditionally seen as a hedge against inflation and it’s not obvious when inflation will pick up.
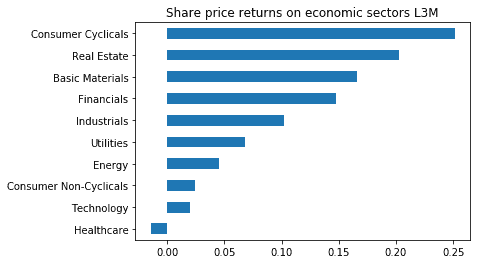
Since late September, Consumer Cyclicals and Real Estate have done particularly well as light at the end of tunnel has been provided by vaccine development news and markets look forwards again:
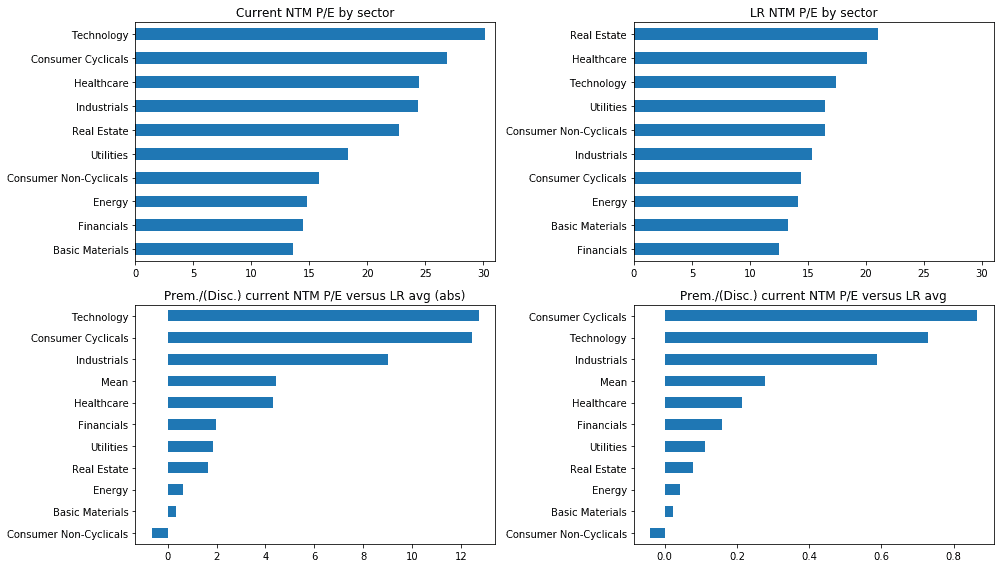
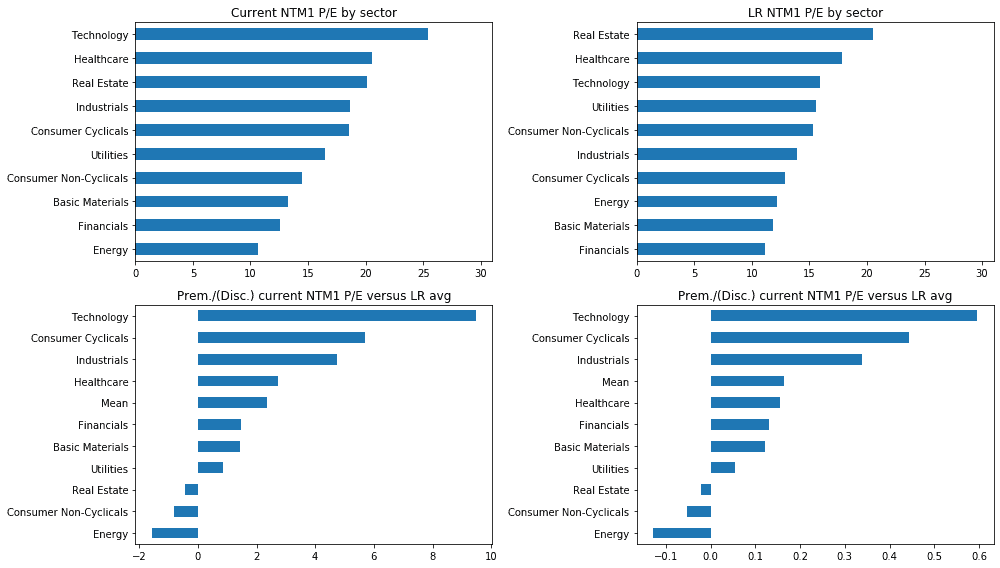
How do P/E valuations compare to long-term averages?
Consumer Cyclicals, Technology and Industrials are all at a greater than 50% premium to their long-term NTM valuations.
It makes sense that this includes some recovery though, so how about if we look further out, and use the 12-24 month forward earnings (‘NTM1’) instead of just the next 12 months (‘NTM’)?
How does yield compare to long-term averages?
Unsurprisingly given the uncertain macro environment and the need to shore up balance sheets, as well as most economic sectors being at a premium on P/E, all sectors yield less than the long-run average bar Utilities:

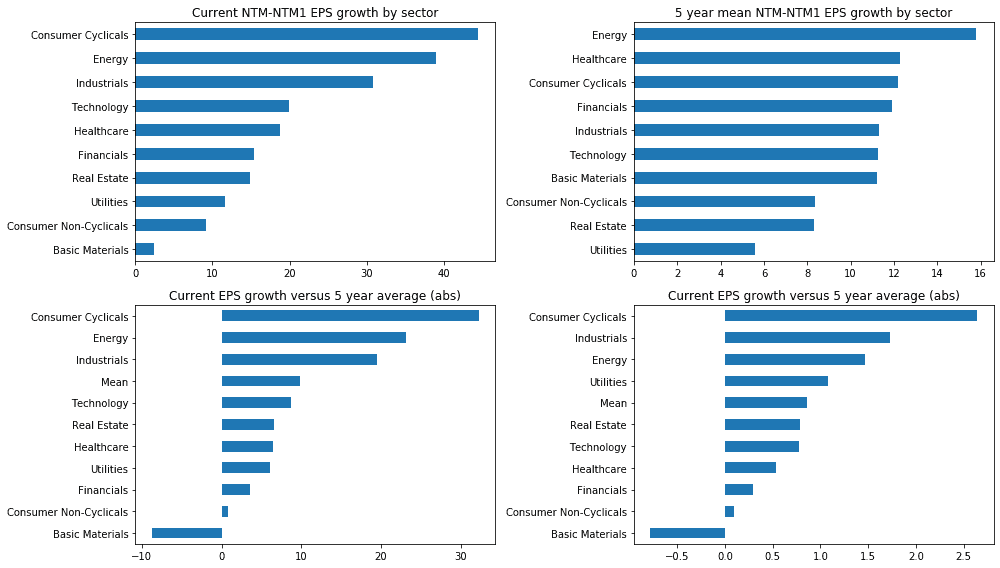
How does growth compare to long-term averages?
When we consider earnings growth in the 12-24 month period we can see why Consumer Cyclicals are at a premium to their long-term average valuation — because they offer slightly over 2.5x the long-term average growth, although of course this is a one-off rebound.
Market and macro
Of course, investing by numbers is fine in normal times. In reality, faced with the sudden change in regime brought about by the global pandemic, institutional investors stopped looking at estimates, and for those in the most affected industries, they considered the health of the balance sheet, any requirement for an equity raise and when that might be.4 It seems fair to say that in the first quarter of the year fear gathered significant momentum as, following the lockdown of Wuhan (a city with a population c. 40% greater than that of New York City) in late January, and then of towns in Italy in late February, it became obvious that Covid was the world’s problem, which led to dislocation in what should be the safest financial market in the world, the US treasuries market, in mid-March.
It is also worth stating that non-US equity markets have responded materially to actions in the US, particularly by the Federal Reserve and to stimulus packages approved by the US legislature. Both the Fed and the EU seemed somewhat slow to get the measure of the crisis, with a reduction by 0.5% of rates by the Fed in early March seen as inadequate, and Christine Lagarde saying that the ECB was ‘not here to close spreads’ i.e. not there to prop up the creditworthiness of the riskier sovereign debt issued by Eurozone countries. In mid-March US rates went to near 0 and in late March the EU committed to €750bn of QE shortly before the Fed committed to purchase of US treasuries with no upper cap and also the extension of QE to the general corporate public debt market in the US, a first. This helped to find a floor in global equity markets and was then followed up by stimulus measures focussed on the post-Covid world, like the Covid-19 recovery fund of €390bn in grants and €360bn in low interest loans to support post-pandemic economic reconstruction announced by the EU in late July.
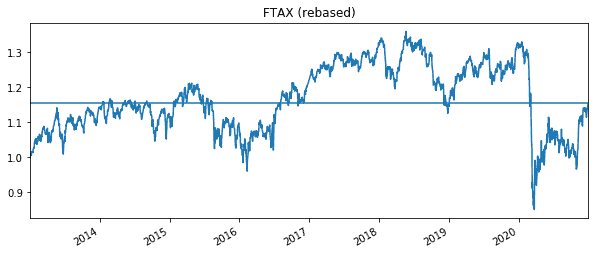
Indeed, repeated actions of this nature by policymakers and central banks are probably the main reason why equity markets have rebounded so much — the S&P500 hit another all-time high in late August and the UK market has recovered too; indeed we are now back where we were towards the end of 2018.5 This is reflective of a broader phenomena which is the correlation of developed equity markets to that of the US, which has increased in recent decades.
An ex-professional investor acquaintance piled into the most affected equities, like airlines, before the Pfizer/Biontech vaccine results were announced as they thought that the true probability of an effective vaccine was discounted by the market. The world-wide rally in equity markets on 9 November once BioNTech/Pfizer’s announced that its Covid-19 vaccine was more than 90% effective showed just how many institutional investors were holding on to cash until things settled down again.
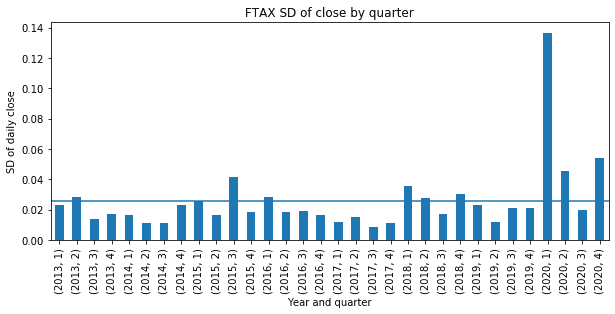
It is somewhat ironic that after the once-in-a-lifetime opportunity to pile in to UK equity markets after the Brexit referendum result in 2016 came another once-in-a-lifetime opportunity to pile in as a result of Corona. Just how volatile it was in Q1 2020 can be seen in the chart below, which shows the mean standard deviation of closing price moves for FTAX in each quarter since 2013.6
And if we consider London (and England), March was the month in which Covid-19 made itself apparent:
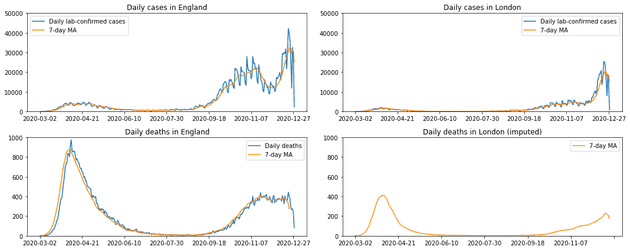 Source: coronavirus.data.gov.uk7
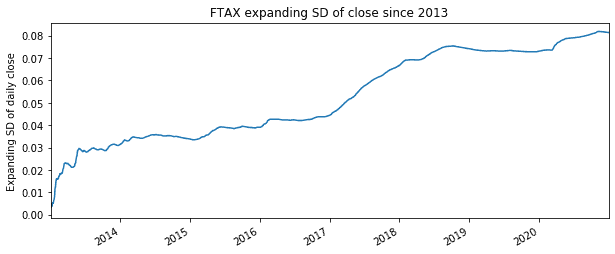
Something else which is worth commenting on is that expectations of volatility based on recent market data should have, it would seem, been on the increase since 2013. In contrast to the time of the ‘great moderation’ under Greenspan before 2008 when equity markets were suspiciously placid, an expanding standard deviation of the daily close since 1 January 2013 increases almost monotonically.8
Much uncertainty remains but for those with an interest in equity markets it has been an interesting year, albeit most will be hoping that 2021 will be more normal.
- Capitalism, Socialism and Democracy, 1942.↩
- There are some large and good companies on AIM so e.g. the AIM100 might be included but for ease of data collation I consider only the main market at the present time. Strictly, I do not consider index weights and so the universe properly described would be the set of FTAX constitutents. If the date is not stated, data is as at close 24 December 2020.↩
- “L’Angleterre est une nation de boutiquiers.” — Napoleon I; “And what is true of a shopkeeper is true of a shopkeeping nation.” — Josiah Tucker, Dean of Gloucester. I think this generalises to the UK although perhaps the Scottish are more adventurous by historical standards. I should point out here that there are plenty of e.g. Scottish companies listed in London.↩
- An equity raise is a good time for insitutional investors to increase exposure, as the discount to the market price tends to be proportional to the size of the equity raise relative to the existing market value of the company.↩
- At the time there were concerns of a slowing global economy, tightening monetary policy, and mounting geopolitical tensions.↩
- The standard deviation is scaled by the mean i.e. y-axis shows standard deviation of daily close (mean over quarter) / daily close (mean over quarter). This is taken from the index so index weights will apply.↩
- Death data by region seems not to have been made available by HMG; deaths in London taken to be the proportion of London cases (of English cases) applied to English deaths.↩
- ‘Expanding’ in this context means the mean or standard deviation of all daily closing prices before that date in the time series. As before, the standard deviation is scaled by the mean i.e. y-axis shows expanding standard deviation of daily close / expanding mean of daily close. 2013 seems like a good place to start given that the ‘taper tantrum’ in H1 2013 was essentially a fear of a return to normality, through the reduction of QE in the US.↩